LCI·GRAPH
An open-source pipeline that turns the LCA literature into a queryable inventory database.
The problem
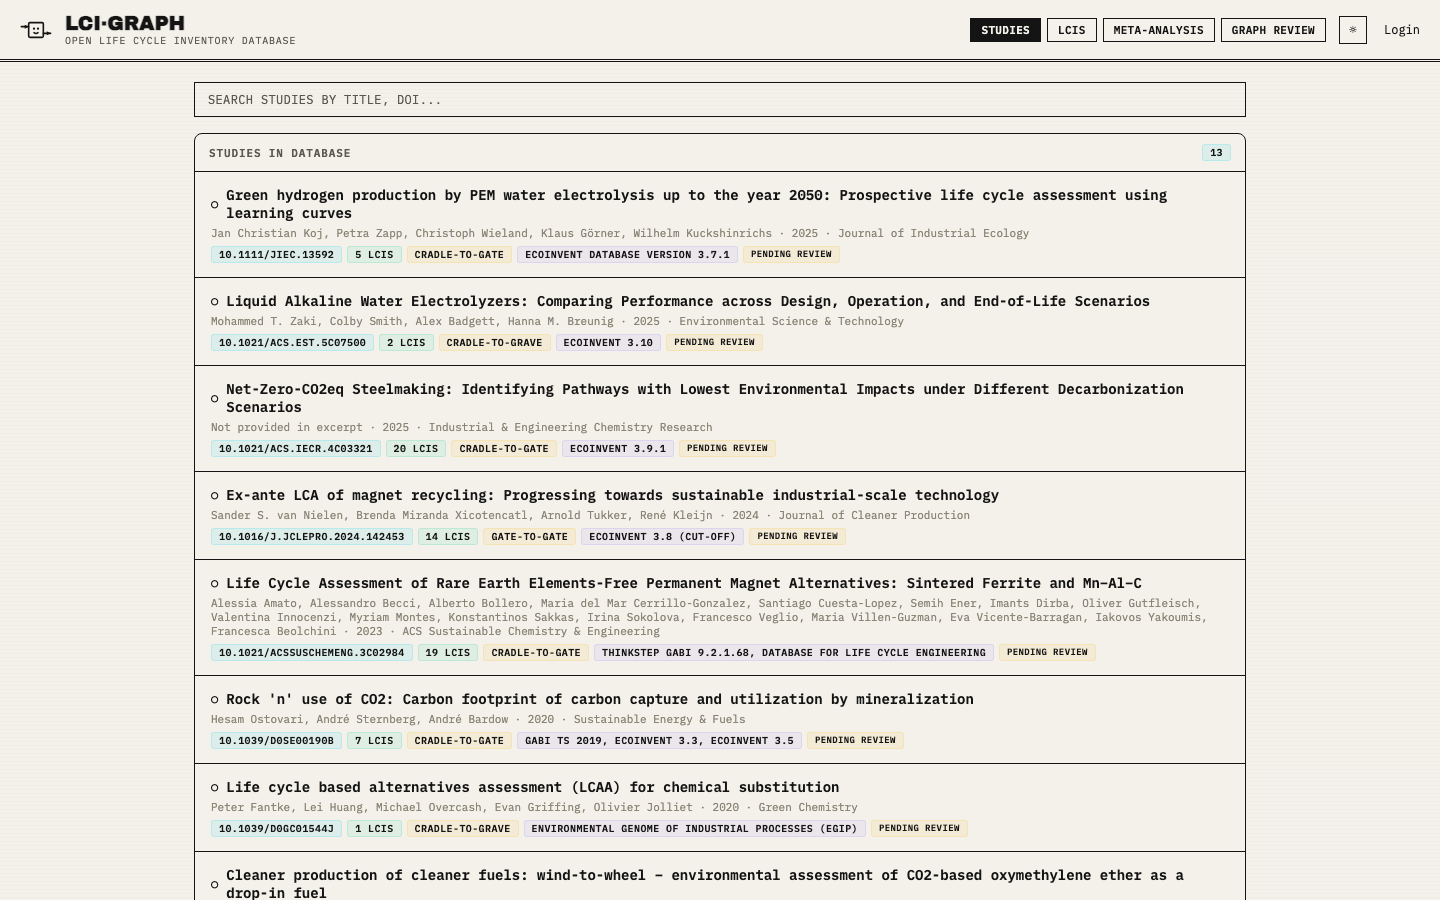
Some of the best life-cycle inventory data in the field is published in academic papers — and then effectively buried. The numbers live in PDF tables and supplementary files, in whatever format the authors happened to use. If you need them, you re-transcribe them by hand; if you want to compare across studies, you first have to undo every paper's idiosyncrasies. Practitioners redo this work over and over, privately, and throw it away.
What it does
LCI·GRAPH ingests a paper and its supplements, extracts the inventory tables, links every flow to a canonical dataset, and stores the result in a database you can actually query — then exports to the formats practitioners already use (openLCA JSON-LD, SimaPro CSV, ILCD, EcoSpold2).
Design decisions
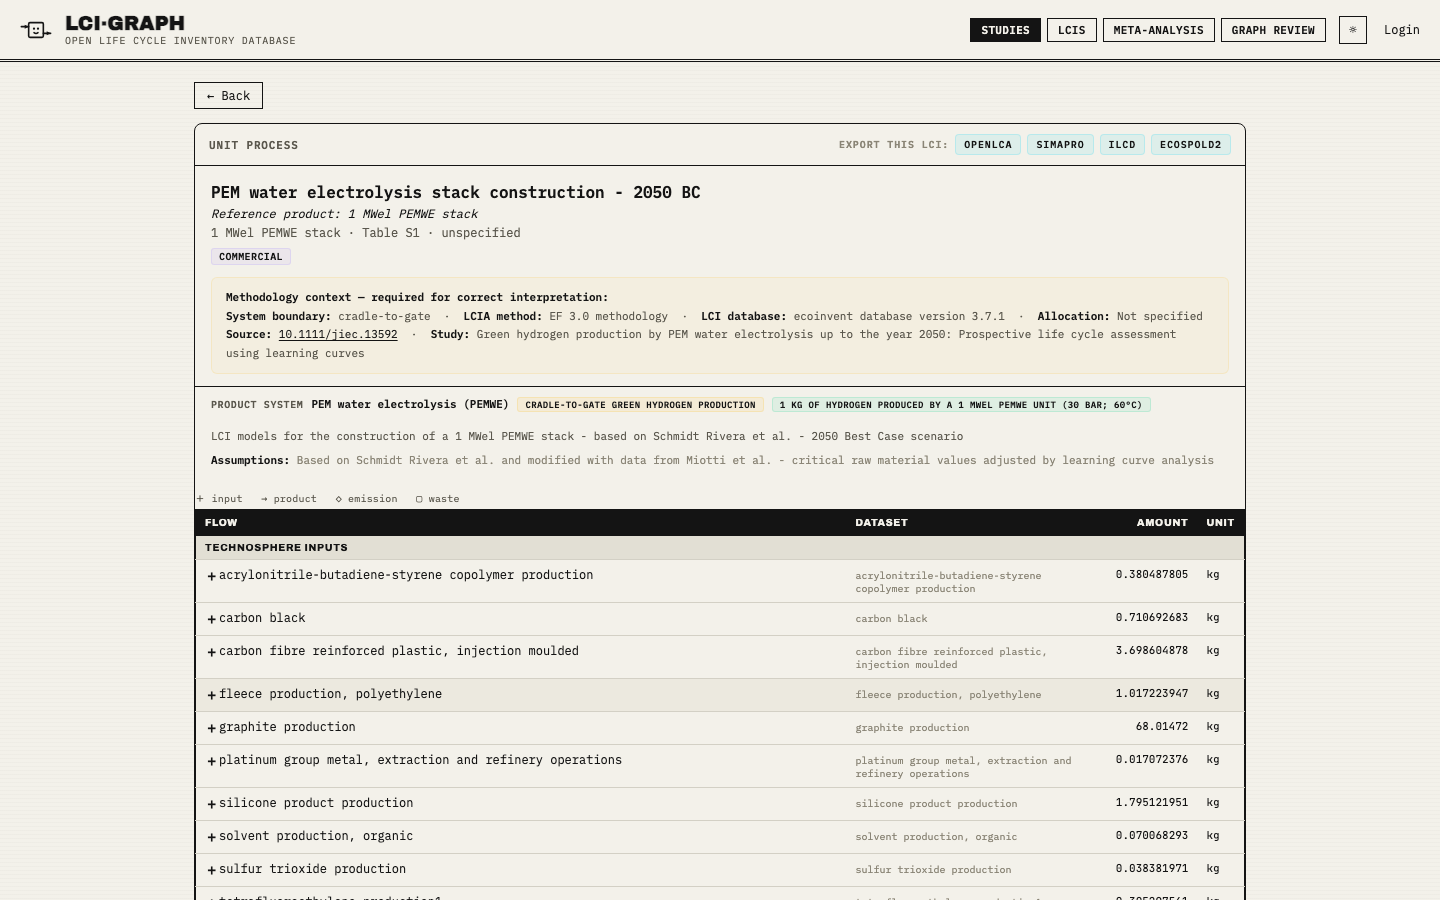
An inventory without its boundary conditions is not data, it's decoration.Every extracted dataset carries its methodology context — system boundary, LCIA method, allocation, source DOI — displayed next to the numbers wherever they appear. Two inventories are only comparable when you know what each one counted.
LLMs draft, rules decide, humans approve. Extraction is done by a language model with structured prompts — no training set, because no two papers format their tables alike. But nothing enters the database as fact: extractions land as pending review, corrections are made in a review interface, and those corrections feed back as extraction rules so the same mistake is not made twice.
Accuracy is measured, not asserted. The pipeline is evaluated against a golden set of hand-verified extractions, so a prompt change or model swap shows up as a number, not a vibe.
Where it stands
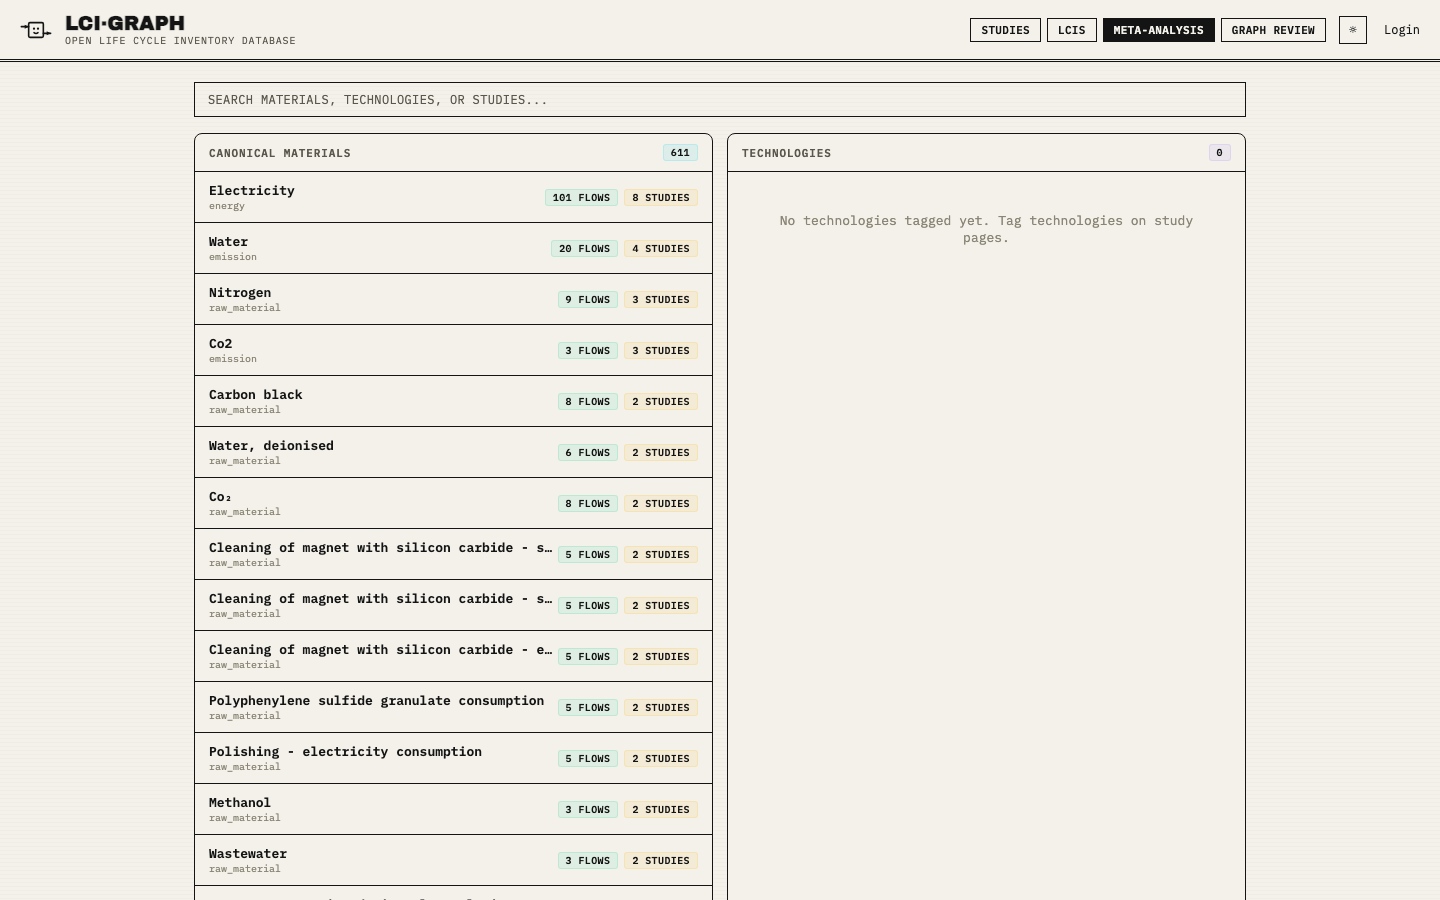
The platform runs locally with a growing set of ingested studies across hydrogen, steel, magnets, and carbon capture. Next steps are the graph layer proper — moving from a relational store to Neo4j so dataset relationships are first-class — and widening the evaluation set before opening contributions.
Screenshots are static snapshots of the local platform; there is no live demo — the database contains other people's published data, shown here for illustration.